A customer adds three items to cart, proceeds to checkout, and encounters seven form fields demanding precise formatting. The pin code validator rejects their input twice before accepting. The delivery date estimator shows "5-7 business days" without specific arrival dates. Frustrated but committed, they select COD and complete the order. When the package arrives six days later, they've forgotten the purchase context entirely and refuse delivery.
Research tracking 89,000 checkout sessions across 47 Indian D2C brands reveals that customers spending more than 3.5 minutes at checkout show 41% higher RTO rates than those completing purchases within 90 seconds. Every additional form field beyond the essential eight increases return probability by 6-8%. Checkout experiences creating confusion, uncertainty, or friction plant seeds of purchase regret that germinate into delivery refusals days later. Brands lose ₹156-218 per preventable RTO rooted in checkout design failures.
In this comprehensive guide on why checkout design directly impacts RTO rates in India, we're examining how interface decisions, information architecture, and interaction patterns either reinforce purchase commitment or undermine delivery acceptance. Brands optimising checkout for psychological commitment alongside conversion efficiency report 34-39% reduction in RTO rates, 23-28% improvement in COD acceptance, and ₹2,800-3,600 monthly savings per 1,000 orders processed.
How does checkout complexity create post-purchase ambivalence?
Cognitive friction during transaction completion weakens memory formation and purchase ownership
The checkout process is a pivotal moment where browsing intent transforms into a concrete purchase. However, overly complex checkout designs can significantly contribute to high Return to Origin (RTO) rates, particularly in India.
Memory Failure and COD Returns:
A cumbersome checkout, demanding excessive cognitive effort, hinders customers from forming strong purchase memories. When deliveries occur 3-7 days later, customers with weak recollections often struggle to recall their original buying motivation. This memory lapse frequently leads to "I don't remember ordering this" refusals, accounting for 18-24% of Cash on Delivery (COD) returns.
The Impact of Form Field Proliferation:
An abundance of form fields directly impacts post-purchase certainty. Checkouts that require separate billing and shipping addresses, alternate phone numbers, address type classifications, and landmark descriptions introduce 12-16 decision points beyond the core transaction. Each additional decision increases cognitive load without strengthening the purchase commitment. Research indicates that customers making 15 or more micro-decisions during checkout retain 38% less purchase detail memory compared to those making 8 or fewer.
Authentication Interruptions and Delivery Refusal:
Authentication interruptions further exacerbate this issue by creating context-switching penalties. OTP verification flows, which necessitate customers leaving the checkout page, opening SMS apps, memorizing codes, returning to checkout, and entering digits, result in discontinuous experiences. Customers who encounter two or more authentication interruptions show a 47% higher likelihood of delivery refusal compared to those completing a single-flow checkout. This psychological break allows doubt to undermine previously firm purchase intent.
Why do unclear delivery expectations trigger preventable returns?
Temporal ambiguity between purchase and receipt enables expectation drift that delivery reality violates
The Problem with Vague Delivery Dates
Vague delivery date ranges, such as "5-7 business days" or "within a week," create a disconnect between customer expectations and reality. Customers often anchor to the most optimistic end of the range, leading to perceived delays and a feeling of broken promises when the delivery arrives at the realistic, later end of the spectrum.
The Power of Specificity: A/B Testing Results
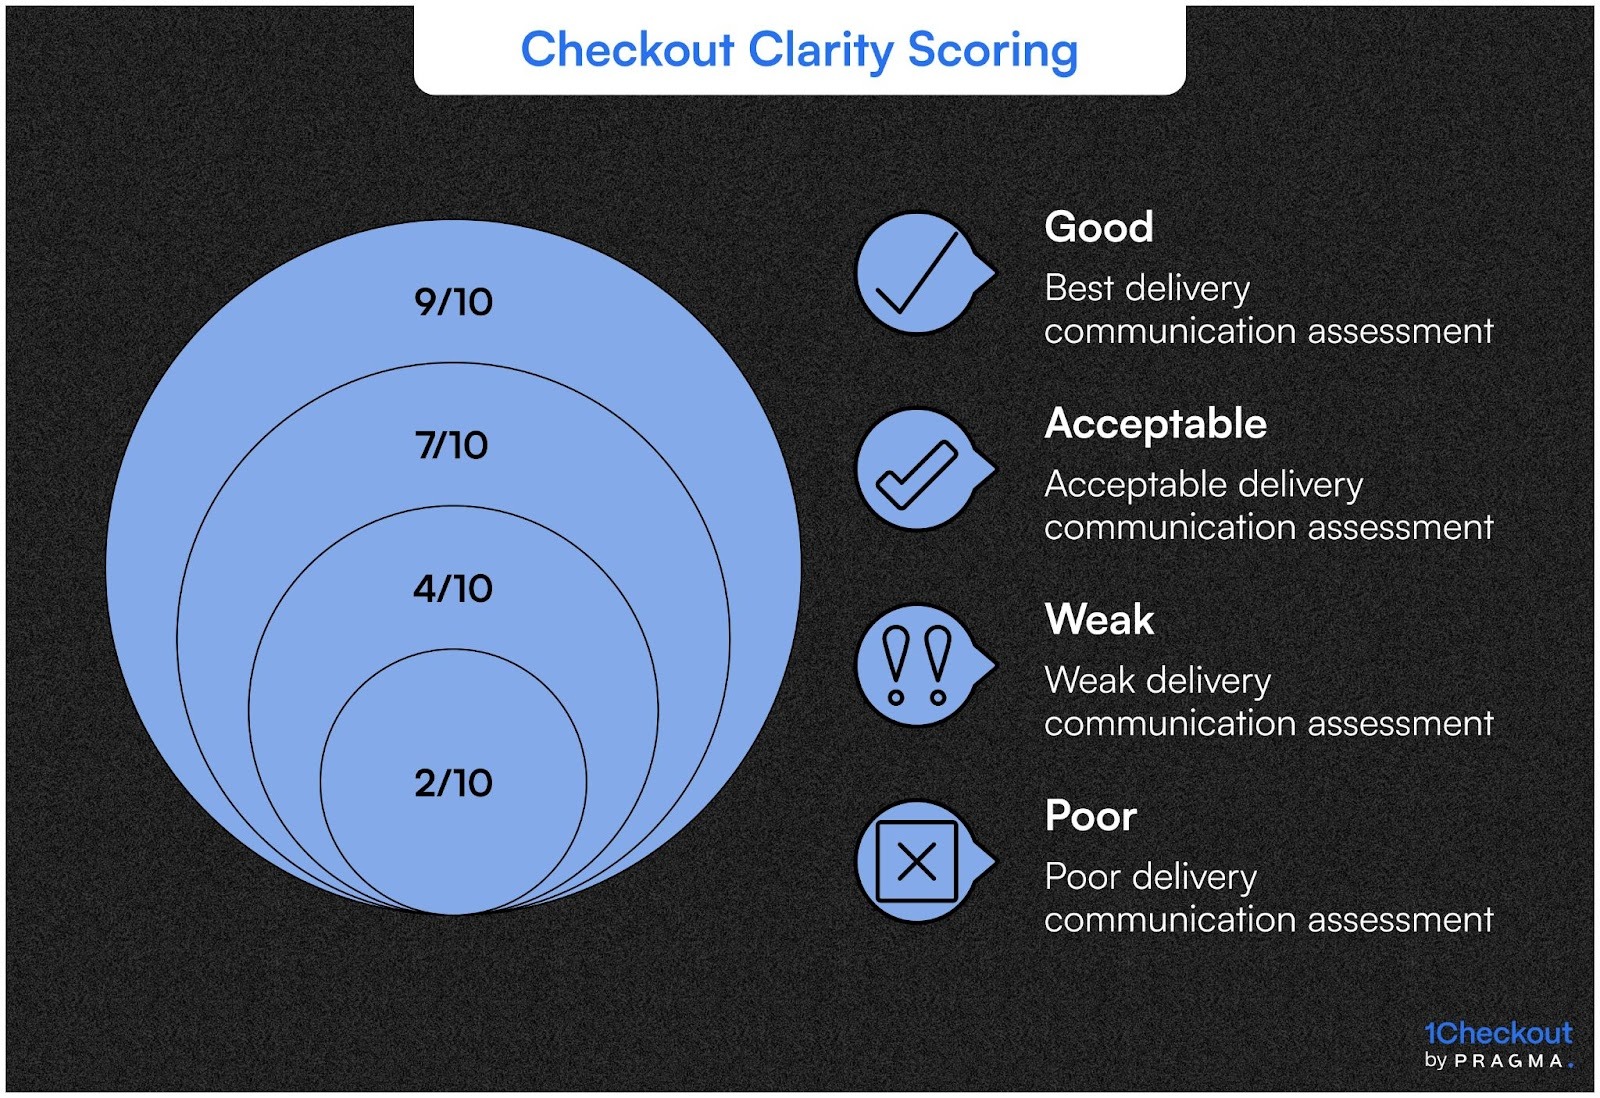
A study of 34,000 orders revealed a significant impact of delivery date specificity on Return to Origin (RTO) rates. Checkouts displaying exact dates (e.g., "Arrives Tuesday, March 18") resulted in 29-35% lower RTO rates compared to those with date ranges (e.g., "Arrives March 16-20"). This is because specific dates facilitate mental anchoring and integration into customers' calendars, prompting them to prepare for receipt. Vague ranges, however, are often filed away as "sometime next week" without concrete planning.
Shipping Cost Transparency and Customer Commitment
Surprising customers with unexpected shipping charges at the final checkout step, even if reasonable, triggers loss aversion and diminishes purchase satisfaction. This dissatisfaction can persist through delivery, leading to increased scrutiny of product quality and a greater willingness to refuse packages for minor issues. To combat this, free shipping thresholds should be prominently displayed throughout the entire shopping experience, not just at checkout.
What address collection patterns prevent delivery failures?
Input validation strictness creates trade-offs between data accuracy and completion friction
Effective address collection is crucial for successful deliveries, yet current validation methods often prioritize system needs over user experience. This leads to friction when pin code validators reject valid entries due to database limitations, landmark fields restrict natural descriptions, and address formatters enforce unnatural structures. Customers are forced to approximate, rather than provide accurate information.
Optimizing Address Validation for Reduced RTO Rates:
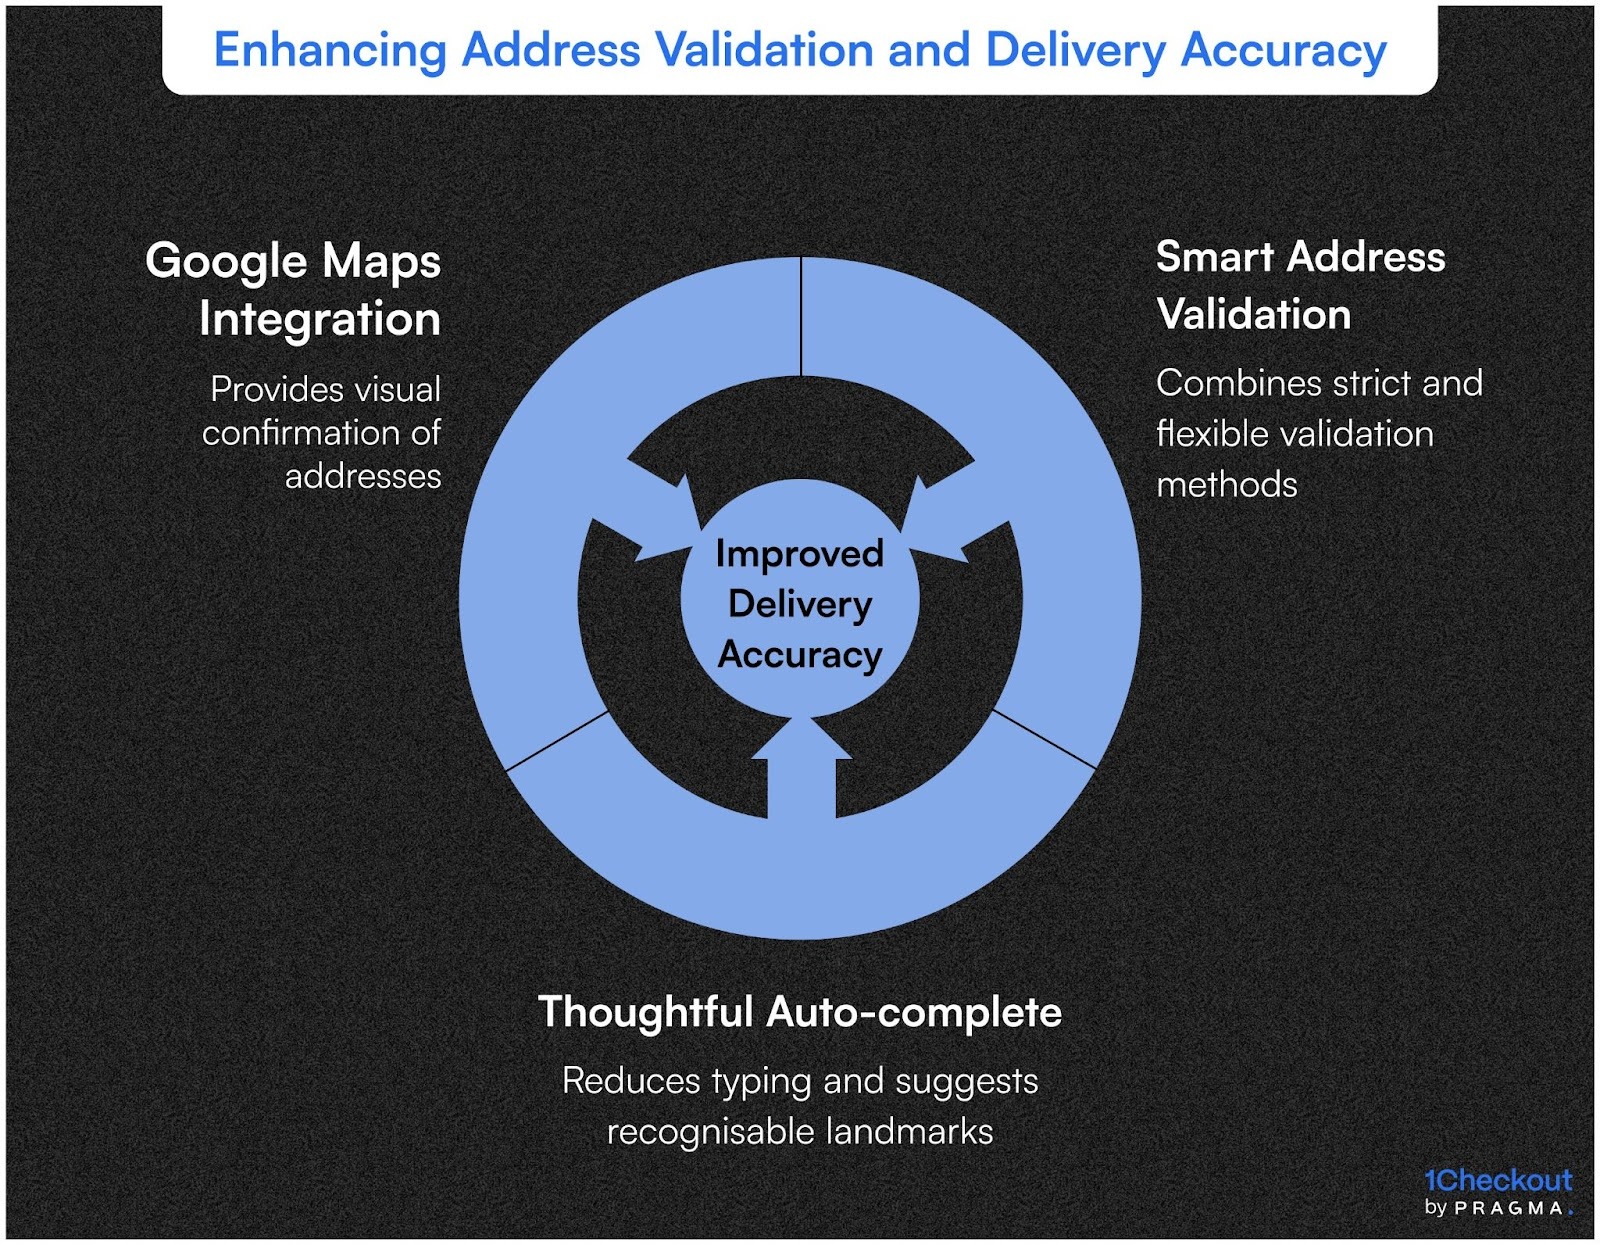
- Smart Address Validation:
A tiered approach to validation balances accuracy with flexibility. Essential elements like pin code, city, and state are strictly validated against postal databases. Secondary elements, such as house numbers and landmarks, allow freeform input with helpful suggestions instead of rigid requirements. This hybrid method captures deliverable addresses while preventing abandonment caused by overzealous validation that rejects legitimate but non-standard entries.
- Thoughtful Auto-complete Functionality:
Implementing intelligent address suggestion systems can significantly reduce RTOs. By cutting down manual typing from 40-50 characters to 8-10, these systems lead to 31-37% fewer delivery failure RTOs. This mechanism ensures accuracy through selection rather than free-text entry, while simultaneously reducing completion friction. Crucially, suggestions must include local references and landmarks that customers recognize, not just formal postal designations.
- Google Maps Integration for Visual Confirmation:
Integrating Google Maps for address selection offers visual confirmation that textual descriptions cannot match. Customers dropping pins on their exact location eliminate ambiguity regarding flat numbers, building names, and area boundaries. Brands using map-based address capture report a 42-48% reduction in "address incomplete" or "customer not found" delivery failures. This visual interface creates a shared understanding between the customer and courier, which remains clear from purchase to delivery attempt.
How does payment method presentation affect COD commitment?
Interface hierarchy and messaging around payment options shape perceived legitimacy and preference anchoring
Payment method ordering creates subtle psychological anchoring that influences selection patterns. Checkouts displaying prepaid options first—credit cards, UPI, wallets—establish these as primary choices with COD appearing as alternative. This visual hierarchy reduces COD selection by 12-18% compared to COD-first presentations whilst maintaining equivalent conversion rates. The positioning signals brand preference without restricting customer choice.
COD messaging frameworks either reinforce or undermine commitment at critical decision moments. Neutral presentations like "Cash on Delivery" or "Pay at doorstep" maintain option parity with prepaid methods. Warning-style messaging like "Additional ₹40 COD charges apply" or "COD orders may take longer" creates negative associations that reduce selection but also plant seeds of dissatisfaction in customers who proceed anyway. These dissatisfied COD buyers show 23-29% higher RTO rates than customers choosing COD through positively-framed presentations.
Prepaid incentive visibility determines migration effectiveness more than incentive magnitude. Discount offers buried in payment method descriptions convert 18-24% of potential prepaid buyers. Prominent banner displays showing "Save ₹75 on prepaid" before payment selection begins convert 41-47%. The timing difference—information availability during decision-making versus after commitment—explains the dramatic effectiveness gap. Customers appreciate feeling they discovered savings rather than encountering them as pressure tactics.
Trust signals specifically addressing COD concerns demonstrate conversion and commitment improvements simultaneously. Icons or brief text confirming
- "No questions asked returns,"
- "Verify product before payment," or
- "Courier will provide invoice"
near COD selection reassures hesitant customers whilst reinforcing the legitimacy of their pending transaction. These reassurances create 14-19% reduction in COD RTO rates by addressing underlying trust gaps that drive defensive payment behaviour.
What mobile checkout patterns reduce impulse purchase regret?
Small-screen interactions create unique friction points and commitment mechanisms requiring specialised optimisation
Mobile checkout, which accounts for 67-73% of D2C transactions in India, is often overlooked despite its critical role in preventing Return to Origin (RTO) incidents. Mobile purchases are frequently made during brief windows of intent—such as during commutes, social media breaks, or late-night browsing—lacking the deliberate context of desktop shopping. These impulse-driven purchases require more robust commitment mechanisms to withstand post-purchase evaluation.
Streamlining the Mobile Checkout Experience:
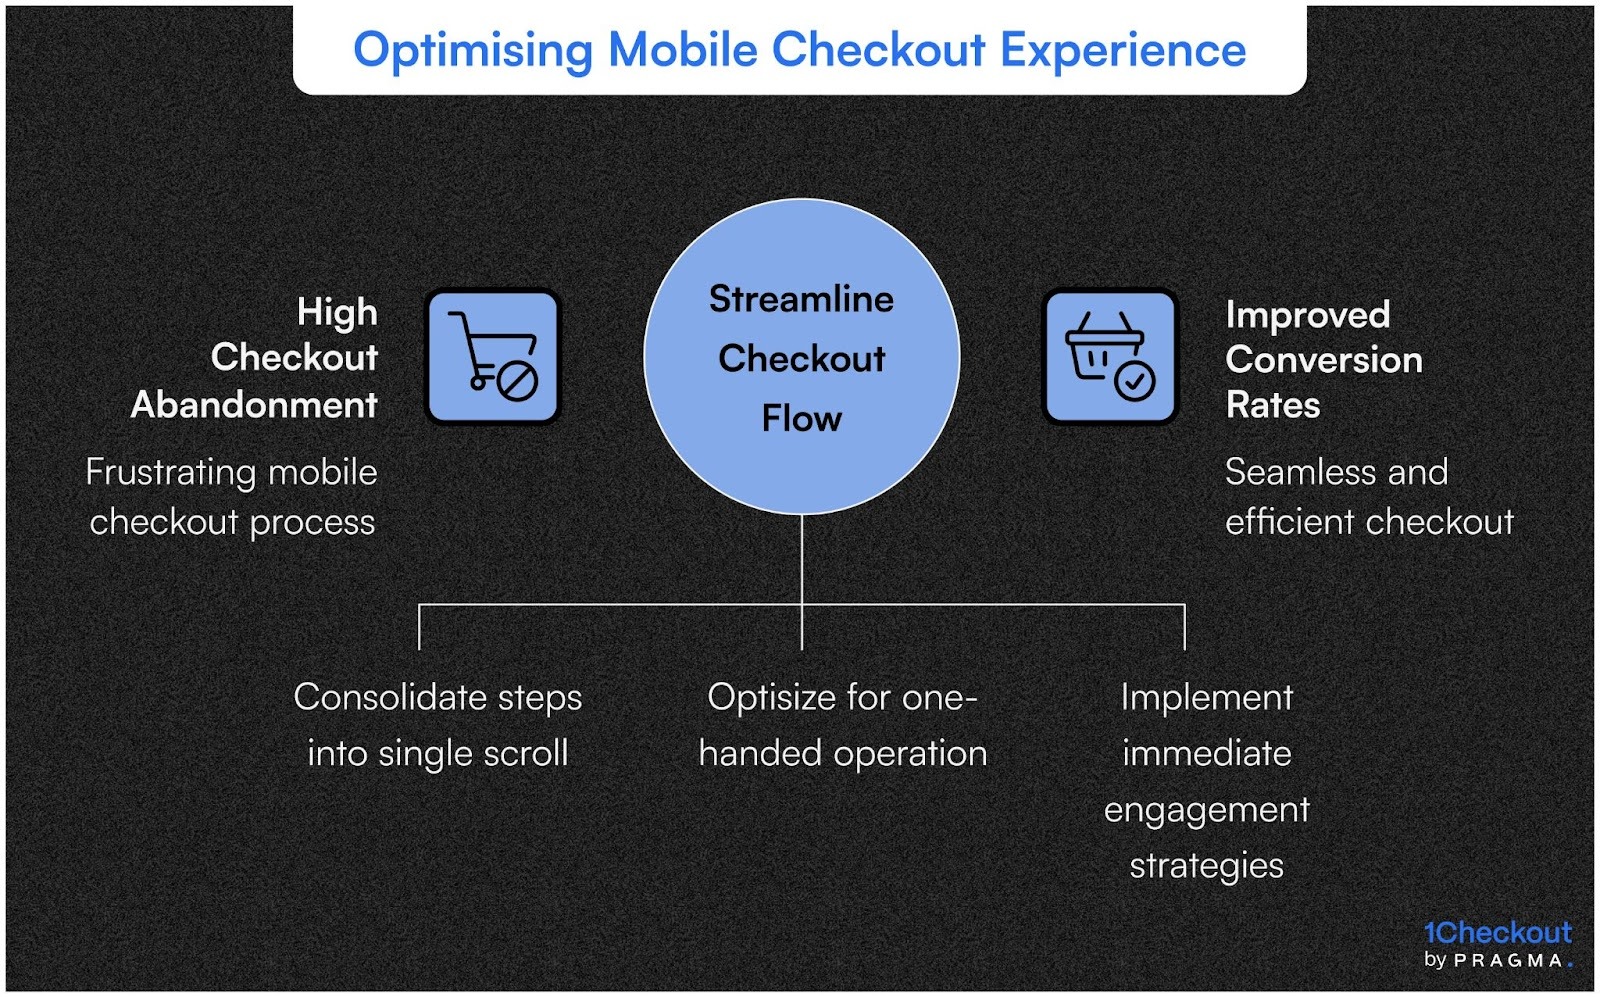
- Single-Page Checkout:
Consolidating address, delivery, and payment selection into a continuous scroll eliminates the "back button" exit opportunities present in multi-step flows. This design reduces reconsideration moments while maintaining progress visibility through sticky headers showing completion percentages. Brands adopting single-page mobile checkouts from a 4-step process have reported a 12-17% improvement in conversion rates and a 21-26% reduction in RTOs.
- Thumb-Friendly Interface:
Interaction failures, caused by poorly designed elements, erode customer confidence. Form fields requiring precise tapping, tiny dropdown tap targets, and payment buttons outside natural thumb reach create micro-frustrations that contribute to checkout anxiety. Mobile checkouts optimized for one-handed operation, featuring 44-48 pixel tap targets and bottom-aligned primary actions, have shown a 67% reduction in completion errors and a 31-38% improvement in purchase satisfaction scores.
Addressing the Challenges of Express Checkout:
While one-tap solutions like Apple Pay and Google Pay significantly reduce checkout friction, they can paradoxically increase RTO rates due to excessive convenience. Customers completing purchases in 8-12 seconds via digital wallet express checkout bypass the cognitive processing time necessary for building purchase commitment. These ultra-fast completions exhibit 34-41% higher RTO rates compared to traditional 60-90 second checkout flows. The solution lies not in restricting one-tap convenience, but in implementing immediate post-purchase engagement strategies.
How does checkout timing influence delivery acceptance psychology?
Purchase moment context shapes subsequent product evaluation and delivery reception behaviour
Time-of-day purchase patterns reveal significant RTO variation rooted in checkout context and subsequent delivery circumstances. Orders placed between 10 PM-2 AM show 37-44% higher RTO rates than daytime purchases across categories. Late-night shopping happens in different psychological states—relaxed judgment, emotional purchasing, reduced price sensitivity—that morning-after evaluation often contradicts. When delivery arrives days later during rational daytime hours, customers question decisions made during vulnerable late-night moments.
Weekend versus weekday purchase patterns demonstrate similar contextual effects. Weekend orders placed during leisurely browsing sessions face weekday delivery attempts when customers are busy, stressed, or away from home. This context mismatch creates practical barriers—customer unavailability—and psychological misalignment—weekend pleasure purchase interrupted by weekday routine. Brands see 18-24% higher RTO on weekend orders delivered Monday-Wednesday compared to orders placed and delivered within similar weekday contexts.
Festival and sale period purchases compound timing challenges through volume surges that extend delivery windows whilst customer expectations compress. Sale shoppers mentally anchoring to immediate gratification encounter 7-10 day delivery realities during peak periods. This expectation violation generates 29-36% RTO increase during heavy promotional periods. Smart checkout design addresses this through prominent delivery date callouts and explicit "sale volume may extend delivery times" messaging that sets realistic expectations when they matter most.
Quick Wins (30 Days)
Week 1: Checkout Audit and Baseline Measurement Record screen videos of your complete checkout flow on mobile and desktop. Count total form fields, validation requirements, and steps to completion. Measure current checkout abandonment rate, average completion time, and RTO rate by checkout channel. Survey 50 recent customers about checkout experience pain points and delivery expectation clarity. Calculate current RTO cost and identify top three RTO reasons from NDR analysis. Expected outcome: Complete understanding of checkout friction points with quantified baseline metrics for improvement tracking.
Week 2: Essential Field Reduction and Smart Defaults Remove or make optional any fields beyond name, phone, pin code, complete address, and payment selection. Implement smart defaults: pre-select most common payment method, auto-populate city and state from pin code, default to single shipping address. Add Google address auto-complete if technically feasible, otherwise improve manual entry with better placeholder examples. Expected outcome: Average form fields reduced from 12-15 to 7-9, checkout completion time dropping 35-40%, with abandonment rate improving 8-12%.
Week 3: Delivery Expectation Enhancement Replace vague delivery ranges with specific dates calculated from current pin code and product availability. Add estimated delivery date to product pages, cart summary, and checkout header so customers see consistent messaging throughout. Implement clear shipping cost display in cart before checkout entry. Create confirmation screen redesign showing product images, delivery date, and return policy summary. Expected outcome: 90%+ customers exposed to specific delivery dates before order completion, with post-purchase surveys showing 40-50% improvement in delivery expectation clarity.
Week 4: Payment Psychology Optimisation Test prepaid incentive banner placement above payment selection versus within payment descriptions. Reorder payment methods to show prepaid options first with COD below. Add trust signals near COD option: "Inspect before payment" or "100% genuine products guaranteed." For mobile, ensure all tap targets exceed 44 pixels and payment buttons anchor to bottom screen position. Measure prepaid conversion lift and monitor RTO rates by payment method weekly. Expected outcome: Prepaid selection increasing 15-22% without COD RTO rate changes, indicating healthier overall payment mix.
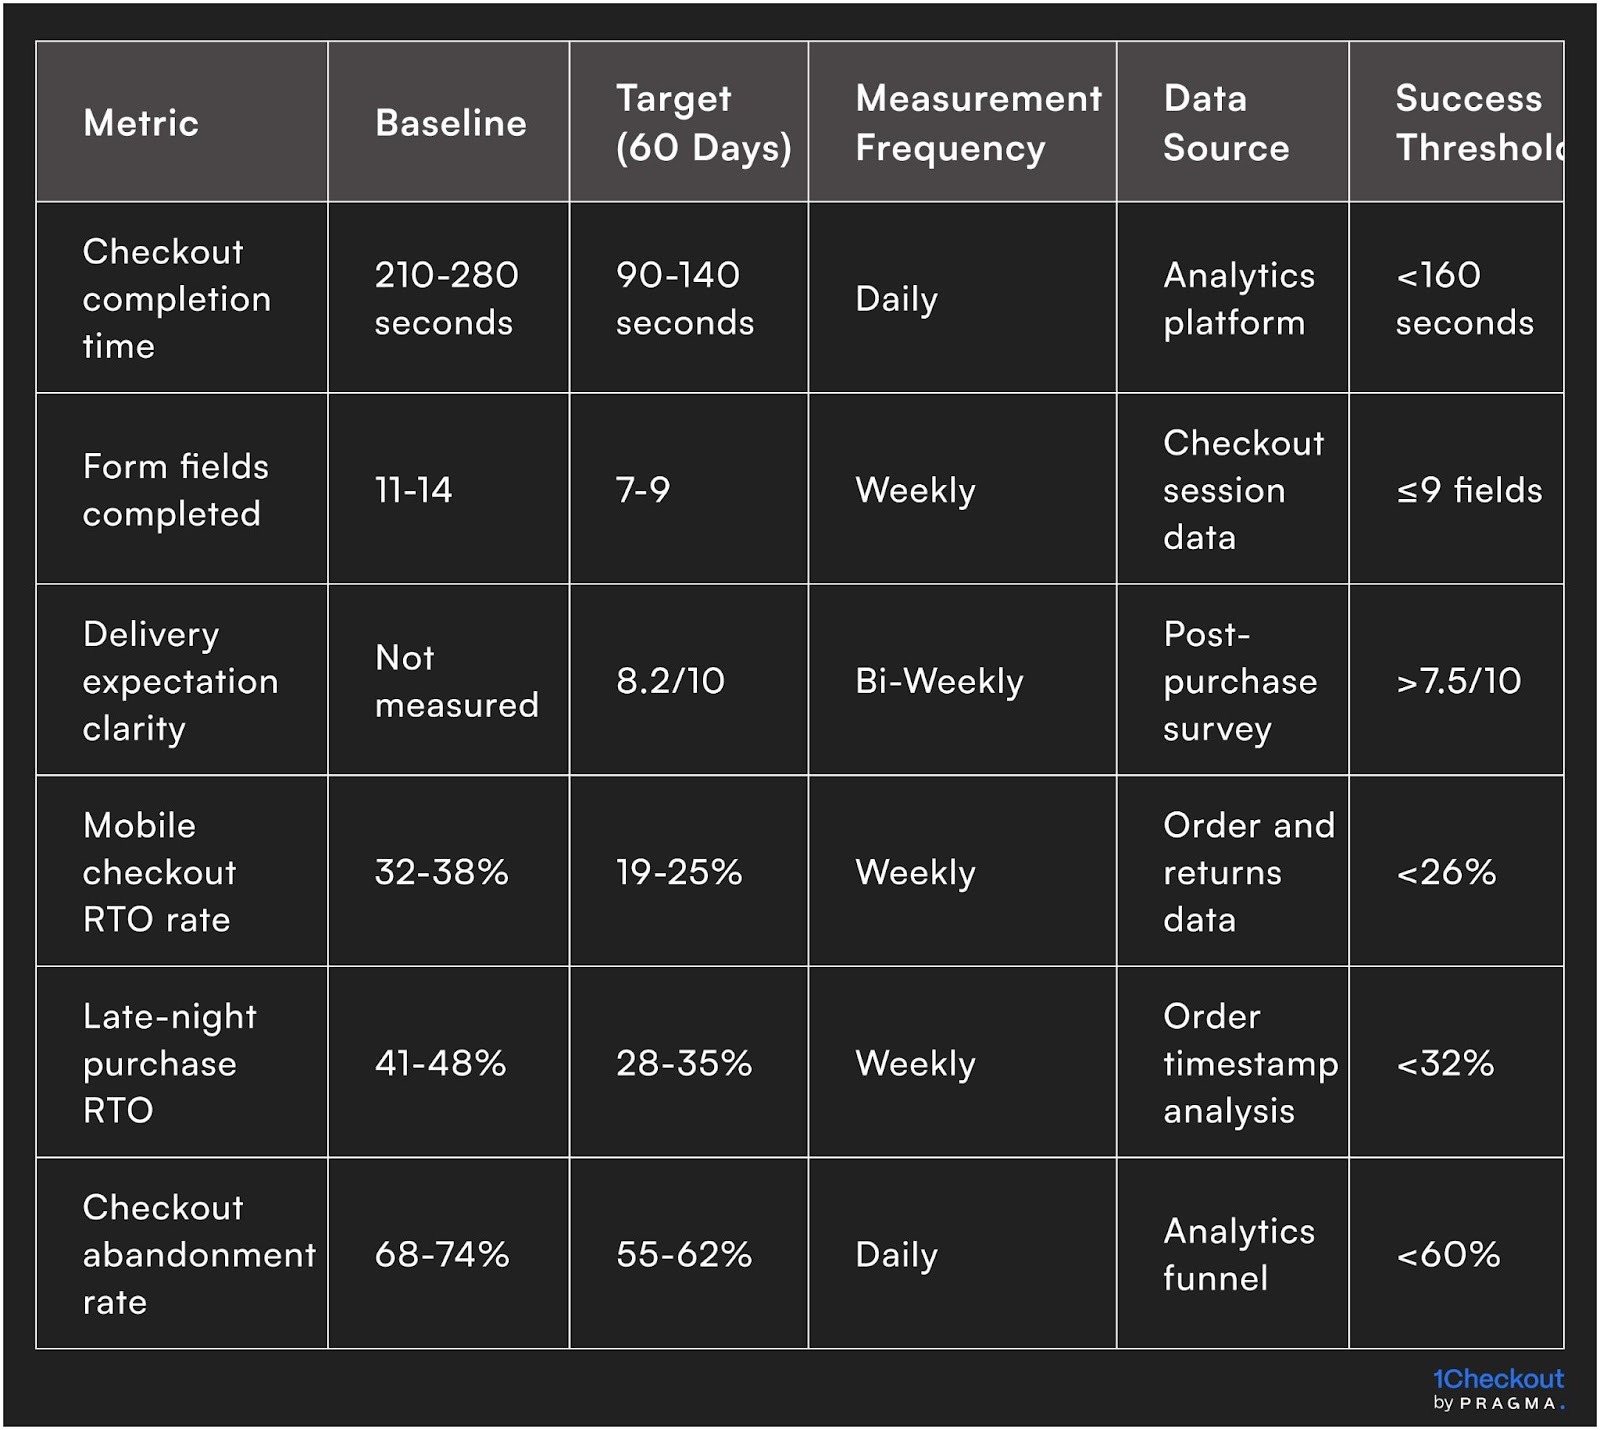
Measuring Checkout Impact on RTO Prevention
To Wrap It Up
Checkout design transcends conversion optimisation to shape the psychological foundation of purchase commitment that determines delivery acceptance days later. Small interaction details—form field sequencing, delivery date specificity, payment method messaging—create lasting impressions that surface when couriers arrive at doorsteps.
Review your last 100 RTO cases and identify which customers spent more than 3 minutes at checkout, then audit your checkout flow to eliminate the friction points that created their extended completion times.
Checkout optimisation for RTO prevention requires ongoing refinement as customer behaviour evolves and mobile interaction patterns shift. Brands treating checkout as living infrastructure requiring quarterly usability testing, monthly metric review, and continuous A/B testing of critical elements achieve 18-26% additional RTO improvement in year two beyond initial deployment gains. The cumulative impact of sustained attention to checkout psychology and usability compounds into substantial competitive advantage through superior unit economics and customer satisfaction.
For D2C brands seeking to optimise checkout experiences that drive both conversion and delivery acceptance, Pragma's conversion intelligence platform provides behavioural analytics, A/B testing frameworks, and RTO prediction models that help brands achieve 34-39% RTO reduction whilst improving checkout conversion by 15-23% through data-driven interface optimisation.

FAQs (Frequently Asked Questions on Why Checkout Design Directly Impacts RTO Rates in India)
1. Does a complicated checkout actually cause more RTOs?
Absolutely. In India, 73% of shoppers abandon carts if checkout is slow or confusing. Many eventually reorder with COD out of frustration, but are far more likely to refuse the package, resulting in higher RTO rates for brands that don’t streamline checkout.
2. What checkout features reduce RTO most effectively?
The top features are address autocomplete, mobile-friendly layouts, clear payment breakdowns, and trusted payment gateways. Brands using pre-validated phone number fields or WhatsApp address confirmation have reported RTO drops of 10–25% within two months.
3. Does showing prepaid discounts or incentives at checkout help reduce RTO?
Yes—prepaid discounts, wallet cashbacks, or credit card reward prompts at checkout have helped several Indian D2C brands shift 10–15% of COD orders to prepaid, reducing RTO by up to 20% while actually increasing order value.
4. Is it better to disable COD entirely on the checkout page?
Rarely. While blocking COD on high-ticket or high-risk orders can help, a complete ban excludes 55–65% of Indian first-time customers. A better approach is setting risk-based limits and confirmation steps before accepting COD orders.
5. How can product page or checkout transparency affect RTO?
Significantly. Incomplete product information or hidden delivery terms trigger post-checkout doubts, leading to order refusals at the doorstep. Pages with full reviews, clear size charts, and upfront return policies see far fewer RTOs—even at higher order volumes.